When I first started learning data analytics, I had no idea where it would take me. Back then, Excel was my trusted companion. Organizing data, creating simple charts it felt like magic at the time. But then something shifted. As I progressed through the Google Data Analytics course, they introduced me to Tableau, and honestly, I didn’t know what to expect. They called it a game-changer for data visualization, but I had my doubts. Could it really do more than Excel? Spoiler alert: it did. And my journey with Tableau has been nothing short of transformative. In this post, I want to take you through my experience as a beginner with Tableau. I’ll share everything from my first steps to the key lessons I learned along the way. If you’re just starting out, this Beginner’s Guide to Tableau is for you.
What is Tableau?
Let’s start with the basics. Tableau is a powerful data visualization tool that turns raw data into insightful, interactive dashboards. Think of it as Excel’s cooler, more creative sibling. While Excel is fantastic for organizing and calculating data, Tableau takes things further by making data visually come alive.
For me, the first time I opened Tableau felt intimidating. It looked so different from Excel. Where were the rows and columns? Where were the formulas? But as I explored, I realized Tableau’s strength lies in its simplicity. Instead of typing out complicated formulas, you drag and drop fields to create charts, graphs, and dashboards. It’s visual and intuitive.
How Tableau Differs from Excel
When I think about Excel, I think about grids and numbers. Excel is perfect for calculating values, running pivot tables, and organizing data. But when it comes to creating visuals that tell a story, Excel can feel a bit limited.
Tableau, on the other hand, is built for storytelling. For example, I once had a dataset with thousands of rows, sales data from multiple regions. In Excel, creating a graph to show trends across regions was a slow, manual process. But in Tableau? It took minutes.
Here’s a quick comparison:
- Ease of Use: Excel needs formulas; Tableau is drag-and-drop.
- Interactivity: Tableau dashboards allow users to click, filter, and interact with visuals.
- Scalability: Tableau handles large datasets without breaking a sweat.
Looking back, I wish I had started using Tableau sooner. It’s not about replacing Excel but knowing when to use the right tool for the job. For visualizing large datasets, Tableau is unbeatable.
Why Beginners Should Start with Tableau
I’ll admit, when I started learning Tableau, I thought it would be complicated. But to my surprise, it was beginner-friendly. If you’re just starting your journey, here’s why I recommend Tableau:
1. Easy Drag-and-Drop Interface
No coding needed. You can create charts and dashboards just by dragging fields onto the canvas. I’m not a programmer, so this was a big win for me.
2. Pre-Built Templates
Tableau has built-in options for bar charts, line graphs, scatter plots, and more. You don’t have to start from scratch. When I created my first dashboard, I used one of their templates, and it looked professional right away.
3. Interactive Dashboards
With Tableau, you can add filters, highlight data points, and make your visuals interactive. I’ll never forget the first time I shared a dashboard where users could click and explore. It felt like magic.
If you’re nervous about trying Tableau, don’t be. It’s designed to make data visualization accessible to everyone, no matter your skill level.
My First Experience Using Tableau
When I started with Tableau, I didn’t know much about connecting data sources. I still remember opening Tableau for the first time and staring at the “Connect to Data” screen. It had so many options: Excel, Google Sheets, databases I’d never heard of. I picked a simple Excel file, sales data I had worked on during the Google course.
Connecting Data
Tableau made it easy to pull in my Excel data. Once I connected it, the columns showed up as fields I could drag and drop. I didn’t need to do any complex setup. It was ready to go.
Creating My First Dashboard
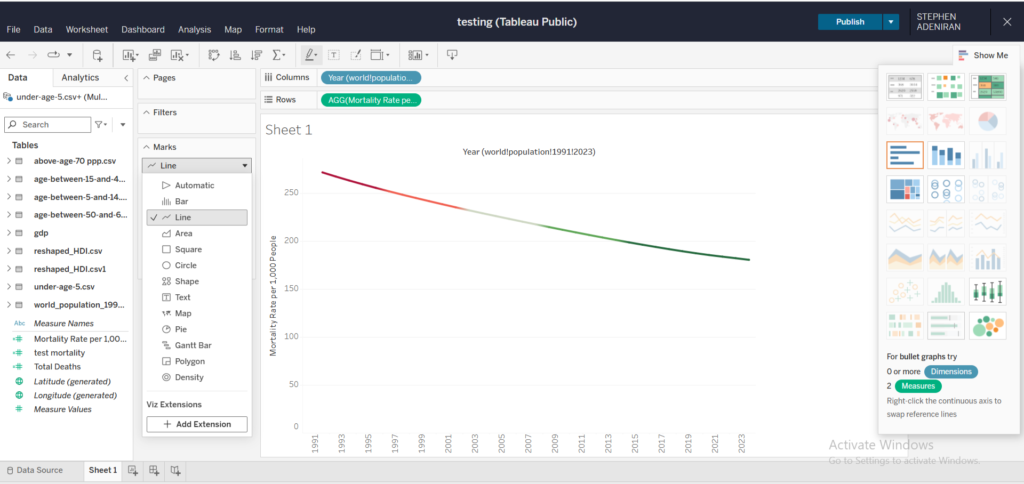
I started small. My goal was to create a bar chart showing monthly sales. I dragged the “Month” field to the x-axis and “Sales” to the y-axis. Just like that, Tableau generated a bar chart. I added colors to differentiate regions, and within minutes, I had a chart that looked like something you’d see in a business report.
That was my “wow” moment. For the first time, I felt like I wasn’t just analyzing data, I was telling a story with it.
Core Features of Tableau
As I explored Tableau, I discovered features that made it stand out. Here are a few that every beginner should know:
1. Data Connections
Tableau can connect to almost any data source: Excel, Google Sheets, SQL databases, cloud platforms, you name it. This flexibility means you can work with data no matter where it lives.
2. Visualization Tools
Tableau offers a wide range of visuals: bar charts, pie charts, scatter plots, heatmaps, and more. One of my favorites is the “Map” feature. I once used it to visualize sales across different states, and it was so satisfying to see the data on an actual map.
3. Interactive Dashboards
This is where Tableau shines. You can create dashboards where users can click, filter, and interact with the data. It’s perfect for presentations.
4. Sharing Insights
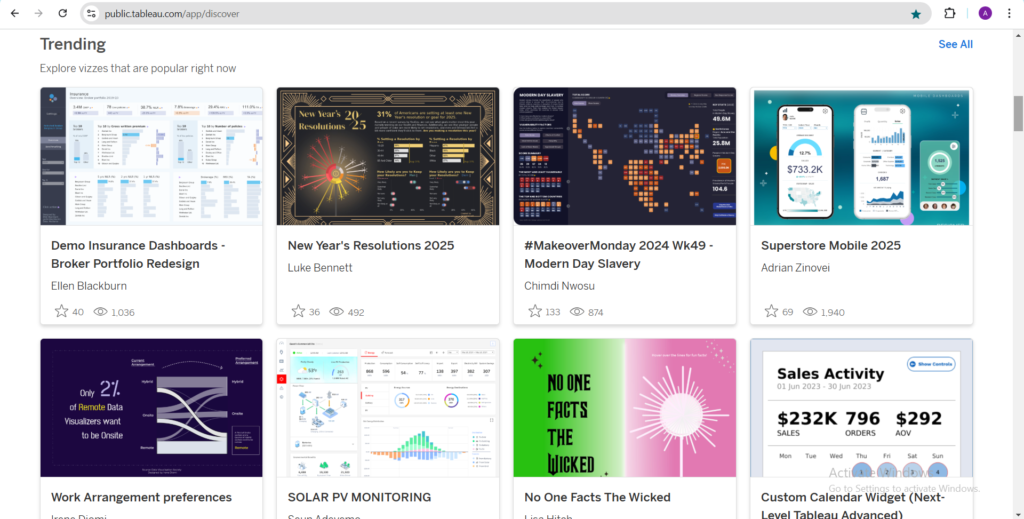
Once your dashboard is ready, you can publish it to Tableau Public or Tableau Online. Sharing insights becomes seamless. I’ve shared dashboards with colleagues and received great feedback on how intuitive they are.
Beginner Tips for Learning Tableau
If you’re just getting started, here’s what helped me:
1. Practice with Public Datasets
I used datasets from Kaggle and Tableau Public to practice. Real-world data gives you hands-on experience.
2. Start Simple
Begin with basic charts. Don’t try to create complex dashboards right away. Focus on understanding how to connect data and create visuals.
3. Learn Through Tutorials
YouTube is full of Tableau tutorials. Watching others create dashboards helped me learn faster. The Google Data Analytics course also had great lessons on Tableau.
4. Experiment
Don’t be afraid to try new features. Tableau is very forgiving. If something doesn’t work, you can easily undo it.
How Tableau Helped Me Grow
Before Tableau, I relied heavily on Excel. My visuals were static, and sharing insights felt limited. Tableau changed that. It made data visualization dynamic and interactive. Here’s how it helped me grow:
- Confidence: Creating dashboards that look professional gave me confidence in my skills.
- Efficiency: Tasks that took hours in Excel now take minutes in Tableau.
- Impact: My visuals now tell stories that resonate with others. Whether it’s sales trends or customer behavior, Tableau makes insights clear.
Where to Start as a Beginner
If you’re ready to start your journey with Tableau, here’s what I recommend:
- Sign Up for Tableau Public It’s free and perfect for beginners. You can practice creating dashboards and share your work online. Sign up here.
- Experiment with Sample Data Tableau comes with built-in datasets to help you practice.
- Learn Through Tutorials Find beginner-friendly courses on platforms like Coursera or YouTube.
- Practice, Practice, Practice The more you use Tableau, the more confident you’ll become. Start with small projects and work your way up.
Final Thoughts
Learning Tableau was one of the best decisions I made as a beginner in data analytics. It transformed the way I approach data visualization and made me realize the power of storytelling through data. If you’re just starting out, I encourage you to give Tableau a try. It doesn’t matter if you don’t know programming yet. Tableau is for everyone.
So, what are you waiting for? Start your Beginner’s Guide to Tableau today and see where it takes you. If I could do it, so can you!
you can read more Data Science post here!
- Master THIS Statistics (Or Get Left Behind)So, here’s the deal. I’ve been in the data world for a bit, and I’ve seen a lot of changes. One thing that hasn’t changed, though, is the need for good stats knowledge. If you’re a data professional, or you want to be one, you really need to get a handle on certain statistical concepts.… Read more: Master THIS Statistics (Or Get Left Behind)
- 15 Best Data Science Internships for Beginners in 2025
 15 Best Data Science Internships for Beginners in 2025 (With Application Tips) Data science internships are the golden ticket for anyone looking to break into this booming field. IBM reports that a mind-blowing 90% of the world’s data has been created in just the last two years. My experience shows how data science expertise creates… Read more: 15 Best Data Science Internships for Beginners in 2025
 - Hidden Patterns in Your Data: A Practical Guide to Exploratory Data Analysis
 Hidden Patterns in Your Data: A Practical Guide to Exploratory Data Analysis When I first started working with data, I kept hearing people talk about exploratory data analysis and honestly thought it was just another fancy term. I mean, how hard could it be to look at data, right? But that confidence crumbled when I… Read more: Hidden Patterns in Your Data: A Practical Guide to Exploratory Data Analysis
Pingback: How to Create Your First Tableau Dashboard in 5 Simple Steps: My Personal Journey