
I recently analyzed a dataset from a shopping mall’s paid search ad campaigns, covering several months of performance. Each entry represents how an individual ad group performed in a specific month, including impressions, clicks, conversions, cost, revenue, and profit or loss.
My Approach
Since I just wrapped up the Statistics section of the Google Advanced Data Analytics Certificate, I wanted to put some key skills into practice:
-
Exploratory Data Analysis (EDA)
-
Descriptive statistics
-
Checking distribution normality
-
Applying the Empirical Rule (68-95-99.7%)
-
Calculating Z-scores to spot outliers
-
Hypothesis testing (two-sample t-test)
My goal was to not only analyze performance but to make business-sensible recommendations that could genuinely improve return on ad spend (ROAS).
The goal of the analysis was simple: to dig into the numbers and figure out which ads are truly profitable, and which ones are just burning cash. I wanted to spot the patterns, uncover what’s working, and highlight where things could be improved.
🔗 Check out the dataset here on Kaggle
💻 View the project notebook on GitHub
You can also view more of my portfolio here, i also write content on Data Analytic/Data Science, you my Blog post here
Project Objectives
1. Understand the distribution and behavior of key performance metrics (e.g., Revenue, P&L, CTR).
2. Apply descriptive and inferential statistics to draw meaningful conclusions.
3. Identify underperforming and overperforming ad campaigns.
4. Use the empirical rule and Z-scores to detect outliers.
5. Run a two-sample hypothesis test to compare performance patterns.
6. Provide data-backed recommendations to improve ad spend efficiency.
ANALYSIS
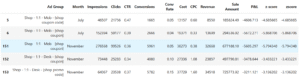
The images below show the head and tail of the dataset, giving a quick glimpse into its structure and content. This helps to understand the kind of variables present and how the data is organized before proceeding with deeper analysis.
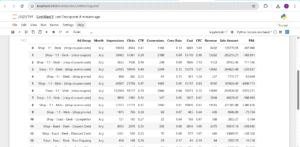
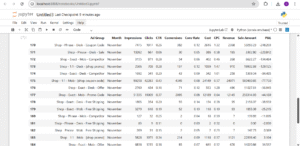
The dataset has 190 rows and 12 columns, with each row representing the monthly performance of a paid search ad group.
Column Overview: Below is the breakdown of what each column means in the context of campaign performance
Ad Group – Type of campaign (e.g., “Coupon Code”, “Promo”)
Month – Month the campaign ran
Impressions – Number of times the ad was displayed
Clicks – Number of user clicks
CTR – Click-through rate (Clicks ÷ Impressions)
Conversions – Number of users who completed a desired action
Conv Rate – Conversion rate (Conversions ÷ Clicks)
Cost – Amount spent on the campaign
CPC – Cost per click (Cost ÷ Clicks)
Revenue – Income generated directly from the ad campaign
Sale Amount – Total value of sales tied to the campaign
P&L – Profit or Loss after subtracting ad cost
Data Quality Check
After inspecting the dataset, I found:
✅ No missing values
✅ All columns are appropriately typed (no string-formatted numbers)
✅ No formatting issues or corrupted entries
So I didn’t need to do any major cleaning.
Descriptive Statistics & Business Observations
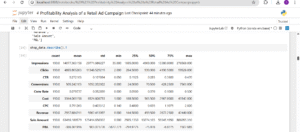
Here’s what stood out when I looked at the summary statistics
Impressions vary greatly — from just 35 to over 276,000. Some campaigns clearly get far more exposure than others.
Clicks follow a similar pattern — some ad groups get just 2 clicks, others get over 99,000.
The CTR (Click-Through Rate) is mostly healthy — the median is 0.285, and the highest performing campaigns hit 0.47.
For Conversions, the median is 70.5, but one campaign hit 7,563, while some had zero — a clear sign of performance gaps.
Conversion Rate ranges from 0% to 50%, but the average sits around 8%, which is decent. That 50% case is rare and might need a second look to check if it’s skewed.
Cost also varies a lot — from $1 to over $43,000, meaning some campaigns were barely funded, others had major investment.
CPC (Cost Per Click) averages at $0.79, with the cheapest being $0.14 and the most expensive $2.02 — this gives me room to study ad efficiency.
Revenue goes from $0 to $42,440, and Sale Amount shows massive sales variance (up to $886,095 in one case).
Most importantly, the average P&L is negative (-$386). Some campaigns lost as much as $5,672, meaning many campaigns are not profitable.
This first look at the dataset confirms there’s a huge difference in how ad groups perform. Some attract big traffic and revenue, while others waste money with poor returns.
The fact that the average campaign runs at a loss signals a serious opportunity to improve how the mall allocates ad budget. My next goal is to dig deeper into patterns, inefficiencies, and hidden opportunities using visual EDA.
Exploratory Data Analysis
1. Campaign Overview: Ad Groups & Performance

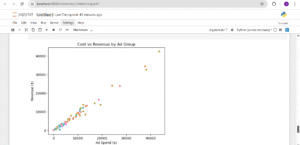
2. Cost vs Revenue Relationship
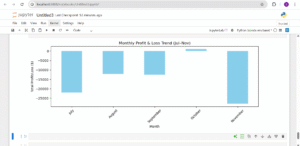
3. Monthly Trend in Profitability Let’s look at how profits changed over time (by month).
The first image above compares the top 10 most profitable and bottom 10 least profitable ad groups. What stands out is that the most profitable campaigns barely made any significant profit, while the worst-performing ones recorded massive losses, some over $5,000. Many of these losses came from mobile ads using promo codes or coupons. This shows that while discounts may drive engagement, they didn’t necessarily result in profitability. On the flip side, campaigns targeting Black Friday, free shipping, or competitors performed relatively better, though their profit margins were still slim. This highlights the need to rethink heavy discount strategies that look good on the surface but end up bleeding money.
The second and third visuals give broader context. The Cost vs Revenue scatter plot shows a strong positive relationship: higher ad spend usually results in higher revenue. But as we can see, high revenue doesn’t mean high profit, some of the highest spenders were still unprofitable. Finally, the monthly profit & loss trend confirms a worrying pattern: every month from July to November ended in a loss, with November, the supposed high season, being the worst. Together, these visuals suggest that while campaigns are generating visibility and sales, poor cost control and strategy are dragging down the overall return on investment.
Statistical Analysis
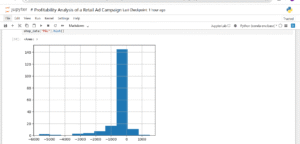
Distribution of Revenue
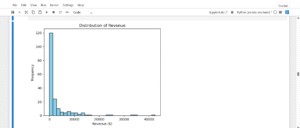
The revenue distribution is positively (right) skewed. This suggests that while the majority of ad campaigns generate relatively modest income, a few standout performers bring in disproportionately high revenue. These top campaigns may be responsible for a large share of total business earnings and should be further analyzed or scaled.
Distribution of CTR
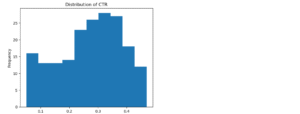
The distribution of Click-Through Rate (CTR) is slightly left-skewed, but still retains a rough bell-shaped curve, suggesting it is approximately normal.
This means most ad groups receive moderate CTRs, typically around the center, while a few perform lower than average.
From a business perspective, this indicates a generally consistent audience response, with room to improve underperforming campaigns on the lower end of the curve through better targeting, creatives, or call-to-action optimization.
Distribution of Conversion Rate
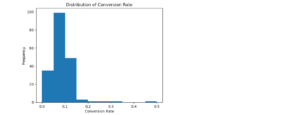
The distribution of Conversion Rate is slightly right-skewed, but maintains an approximately normal (bell-shaped) form.
This suggests that most ad groups convert at a moderate rate, with a few campaigns achieving unusually high conversion rates.
From a business perspective, this means the majority of ads perform consistently in turning clicks into conversions, while some standout campaigns may offer clues for optimization or scaling.
Empirical Rule & Outlier Detection on P&L
Every business exists to make profit and that’s why I’m making Profit and Loss (P&L) the main focus of this analysis. To make smarter decisions, I want to understand how profit behaves across different ad campaigns.
In this step, I’ll:
Check whether P&L follows a normal distribution
Apply the Empirical Rule (68–95–99.7%) to see how much of the data lies within 1, 2, and 3 standard deviations from the mean
Use Z-scores to detect potential outliers — ad groups that are either big losses or outstanding performers
This will help me identify what’s working, what’s not, and where the business might be leaking or gaining the most money.
Empirical rule
Since the normal distribution seems like a good fit for the Profit and Loss data, we can expect the empirical rule to apply relatively well. The empirical rule says that for a normal distribution:
- 68% of the values fall within +/- 1 SD from the mean
- 95% of the values fall within +/- 2 SD from the mean
- 99.7% of the values fall within +/- 3 SD from the mean
NOTE: “SD” stands for standard deviation.
In other words, we can expect that about:
- 68% of ad campaign Proft and Loss data will fall within +/- 1 SD from the mean.
- 95% of ad campaign Profit and Loss data will fall within +/- 2 SD from the mean.
- 99.7% of ad campaign Profit and Loss data will fall within +/- 3 SD from the mean.

The mean of the profit and loss is -386.36, and the stadandard deviation is 903.07.
Now lets compute the actual percentage of the profit and loss that falls within +/- SD from the mean. i will create two new variables using the mean and standard deviation result. The new variables will be name lower limit and upper_limit.
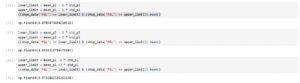
After analyzing the distribution of P&L, I tested how well it aligns with the Empirical Rule (68–95–99.7%), which applies to normally distributed data.
My results show:
87.9% of P&L values fall within ±1 SD
95.3% fall within ±2 SD
97.4% fall within ±3 SD
These results are quite close to what the empirical rule predicts, which confirms that the data behaves mostly normal, even though it’s slightly skewed.
The fact that 87.9% of the values fall within just 1 standard deviation (higher than the expected 68%) tells me that the P&L values are tightly packed around the mean, with fewer extreme shifts. In business terms, it suggests that most ad campaigns are clustered around similar loss or profit levels and only a few are outliers. This supports the use of further statistical techniques like Z-scores.
Next, I’ll compute Z-scores to detect outliers.
In this case, an outlier is an ad campaign whose profit or loss is far from the average, either a major loss that’s hurting the business, or an exceptional performer that could be scaled further.
Hypothesis Testing
In this step, I want to perform a two-sample hypothesis test to compare whether the average revenue generated by high-loss ad campaigns is significantly different from that of the normal-performing campaigns. This will help me understand if these loss-making campaigns are at least driving strong sales volume, or if they’re simply unprofitable without delivering business value.
Steps for performing an Hypotheis testing
- State the null hypothesis and the alternative hypothesis.
- Choose a significance level.
- Find the p-value.
- Reject or fail to reject the null hypothesis.
Step 1: State the null hypothesis and the alternative hypothesis.
Null Hypothesis: There is no significant difference in average revenue between high-loss and normal campaigns.
Alternative Hypotheis: There is a significant difference in average revenue between the two groups.
This is the probability of rejecting the null hypothesis when it is true. For this project i will be using 5% or 0.05.
Step 3: Find the p-value
Based on the group data, the difference between the mean Revenue of Group A and Group B is 20,233.4. The null hypothesis claims that this difference is due to chance. The p-value is the probability of observing an absolute difference in group means that is 20,233.4 or greater if the null hypothesis is true. If the probability of this outcome is very unlikely—in particular, if the p-value is less than the significance level of 5% then i will reject the null hypothesis.
Most ad groups are unprofitable.
- Coupon-based mobile ads consistently perform poorly.
- Only a few campaigns (Black Friday, Competitor targeting) actually deliver profit.
- Ad spend increases revenue but not necessarily profit.
- Revenue is not the same as return—many high-revenue ads still lost money.
- Monthly trends show no continuous improvement, indicating poor campaign optimization.
Business Insights
- Many ads are spending too much for too little return.
- Profit-focused optimization is missing, strategy seems to chase clicks or revenue instead.
- Seasonal or competitor-focused campaigns are a better use of resources.
- Campaign managers must track profit, not just engagement metrics.
Recommendations
- Pause or rework coupon-based campaigns, especially on mobile.
- Prioritize top performers like Black Friday/Cyber Monday and competitor-targeting.
- Implement monthly z-score analysis to flag high-loss campaigns early.
- Adopt performance-based budgeting—allocate more to proven profitable ad groups.
- Introduce A/B testing monthly to keep learning what works.