
Google Professional Data Analytic Capstone Case Study (Bellabeat)
Submitted BY: Stephen Adeniran
Updated By: December 25th, 2024
Introduction
When faced with several intriguing case studies, I chose Bellabeat because its mission deeply aligns with my passion for improving health through data. The opportunity to find answers to critical questions and highlight solutions that could directly impact people’s well-being is what drew me to this project.
This case study goes beyond analysis but about connecting insights to real-world solutions. As a junior data analyst, I was tasked with working on the Bellabeat marketing analytics team to uncover actionable insights from smart device usage data. This journey allowed me to explore the intersection of health, technology, and data, combining analytical rigor with creativity to propose strategies that empower users and drive business growth.
The process involved following the six steps of data analysis: Ask, Prepare, Process, Analyze, Share, and Act. Each step was carefully executed to ensure a thorough and insightful approach to answering key business questions. By the end of the project, the findings became a powerful addition to my portfolio, showcasing not only my technical skills but also my ability to craft data-driven narratives for decision-making.
About Bellabeat
Bellabeat is a high-tech company specializing in smart wellness devices designed to empower women with insights into their health and habits. Founded in 2013 by Urška Sršen, an artist, and Sando Mur, a mathematician, Bellabeat combines artistic design with cutting-edge technology to inspire and inform women worldwide.
The company offers a range of products that collect data on activity, sleep, stress, hydration, and reproductive health. This data helps users understand their habits and make informed decisions about their wellness. Over the years, Bellabeat has positioned itself as a leader in the women-focused wellness tech space, growing rapidly and establishing offices across the globe.
Bellabeat’s product lineup includes:
- Bellabeat App: Tracks activity, sleep, stress, menstrual cycles, and mindfulness habits, providing personalized health insights.
- Leaf: A wearable wellness tracker available as a bracelet, necklace, or clip, connecting to the app for activity, sleep, and stress monitoring.
- Time: A wellness watch that blends classic design with smart technology, offering daily wellness insights through the app.
- Spring: A smart water bottle that monitors hydration levels and integrates with the app to encourage optimal water intake.
- Membership Program: A subscription service offering personalized guidance on nutrition, activity, health, beauty, and mindfulness.
A Clear Summary of the Business Task
The primary business task for this Bellabeat case study is to analyze smart device usage data from non-Bellabeat devices called Fitbit Fitness Tracker Data to uncover consumer behavior trends. These insights will serve as a foundation for Bellabeat’s marketing team to:
- Identify key trends in smart device usage that are relevant to health and wellness.
- Understand how these trends apply to Bellabeat’s target audience, specifically women using health-focused devices.
- Develop data-driven marketing strategies for one specific Bellabeat product, ensuring alignment with consumer preferences and behavior.
For this case study, I’ve chosen to focus on the Leaf product, applying these insights to guide data-driven marketing strategies that align with consumer preferences. The ultimate goal is to provide actionable recommendations to help Bellabeat grow its presence in the global smart device market.
Summary of All Datasets Used
For this analysis as i mentioned in the business task above, I used a dataset that captures smart device usage data from non-Bellabeat products called Fitbit Fitness Tracker Data. The dataset includes aggregated, fitness tracker data from 03.12.2016-05.12.2016. Thirty eligible Fitbit users consented to the submission of this personal tracker data and its made available by Mobius, a public data-sharing initiative. The data encompasses key health metrics such as:
- Daily activity: Steps taken, distance covered, and active minutes.
- Sleep patterns: Hours slept and sleep efficiency.
- Heart rate data: Resting and active heart rate averages.
- Caloric activity: Calories burned through exercise and other activities.
- Weight Log Info, Heart rate and so on
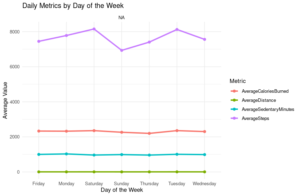
The chart highlights weekly activity trends, showing Sunday as the most active day with users taking the most steps and covering the longest distances. Despite this, calorie burn remains steady throughout the week, suggesting other factors like metabolism play a role. Sedentary minutes show little variation, pointing to consistent low-movement behavior.
Now lets go even more deeper, lets explore the relationships between Total Steps and Calories Burned
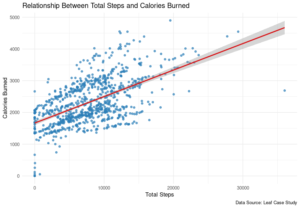
The visualization highlights a clear positive trend: as total steps increase, calories burned also rise, shown by the red regression line indicating a linear correlation. The shaded area around the line reflects the confidence interval, suggesting most data points align with this trend, though some variability exists.
Most users fall within the 5,000 to 15,000 steps range, burning around 2,000 to 3,500 calories. But here’s the interesting thing, there are outliers where individuals burned fewer calories despite high step counts or significantly more calories with fewer steps. These outliers may be influenced by factors like metabolic rate, body composition, or the intensity of activities not captured by step counts.
To further understand the relationship, let’s examine Sedentary Minutes periods of inactivity where steps are not taken and explore whether they also relate to calorie burn. Could it be that even when individuals are sedentary, their bodies still exhibit some energy expenditure? Let’s find out.
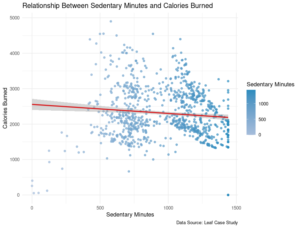
This visualization reveals a slight negative trend between sedentary minutes and calories burned. The red trendline suggests that as sedentary minutes increase, calorie burn tends to decrease slightly, but the scattered data points indicate a weak correlation.
Notably, there are outliers where individuals burn a significant number of calories despite high sedentary minutes, suggesting that other factors, such as metabolism or brief periods of intense activity, may play a role. Could it be that even during prolonged periods of inactivity, the body still finds ways to expend energy? Wow, lets move forward.
Now, How does the overall daily activity, including sedentary behavior, affect sleep duration?
Lets check the Total Minutes Asleep and Total Steps. Total Minutes Asleep is the time someone spends asleep in a day, while Total Steps shows the cumulative number of steps taken throughout the day, serving as a measure of physical activity. Let’s see if being more steps impacts how much we sleep
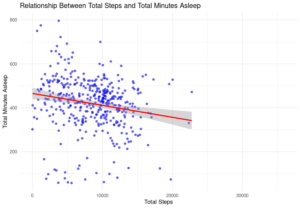
The data shows an intriguing relationship between Total Steps and Total Minutes Asleep. With a correlation of -0.19, there’s a weak negative trend, more steps during the day slightly correlate with less sleep at night. While subtle, the trendline reflects this pattern.
One possible explanation is that individuals who are highly active may also be more restless, which could reduce their total sleep time. However, this raises an important question: does decrease activity increase sleep duration? Lets find out together
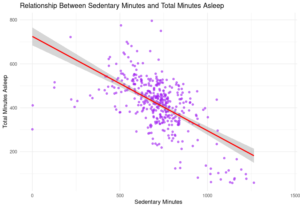
The calculated correlation between these two variables is -0.601, which suggests a moderate negative relationship. This means that as sedentary minutes increase, total sleep duration tends to decrease. The graph attached clearly illustrates this trend, with a noticeable downward slope. One reason for this trend could be that extended sedentary periods might disrupt the body’s natural energy balance, making it harder to transition into restful sleep. This could stem from reduced physical exertion, which often helps improve sleep quality and duration. It also raises an intriguing question: could prolonged inactivity impact not just how long we sleep but how efficiently we sleep? This sparks curiosity to explore sleep efficiency next, wow!.
Sleep efficiency is the ratio of the actual time spent asleep to the total time spent in bed, expressed as a percentage. It indicates how effectively someone is sleeping during their time in bed. I calculated sleep efficiency using the formula:
TotalMinutesAsleep / TotalTimeInBed * 100.
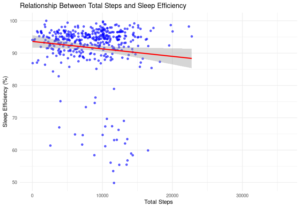
The data shows a slight negative trend between Total Steps and Sleep Efficiency. This suggests that as the number of steps increases, sleep efficiency tends to decrease slightly. But the majority of sleep efficiency values remain above 90%, indicating only a minor impact on how efficiently users sleep.
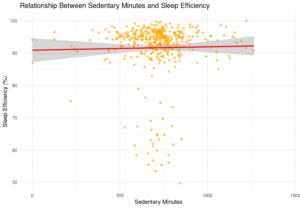
The data reveals no significant relationship between Sedentary Minutes and Sleep Efficiency. Most users maintain a sleep efficiency of around 90%, regardless of their level of inactivity.
Let’s take a closer look at how calories burned relate to weight, with BMI adding some extra color to the story.
BMI Definition: Body Mass Index (BMI) is a simple calculation that helps categorize weight ranges. It’s your weight in kilograms divided by the square of your height in meters, giving insights into whether someone is underweight, healthy, overweight, or obese.
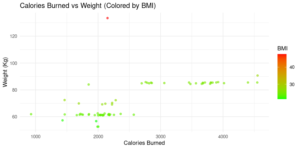
This chart shows how calories burned relate to weight, with BMI adding some context through the colors. We see a general trend where individuals who burn more calories tend to have lower weights, which aligns with our understanding of how energy expenditure influences body weight. However, we also notice an interesting outlier – a data point with a significantly higher weight despite burning fewer calories. This outlier might suggest individual variations or potential confounding factors that are not captured in the current data.
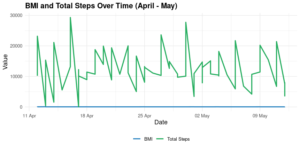
Okay, so looking at the chart, it seems like BMI and total steps are both pretty variable over the time period. There’s not a super clear trend in either one, but it looks like there might be some interesting fluctuations. For example, there’s a big spike in steps around the 20th of April, and the BMI seems to go up and down a bit around that time too. This suggests a potential dynamic relationship between physical activity and BMI, though further analysis is needed to establish a definitive link.
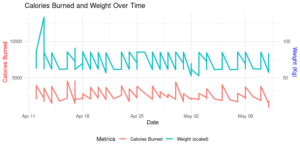
This chart above shows the relationship between calories burned (red) and weight (blue) over time. While calories burned fluctuated daily, weight remained relatively stable. This suggests that short-term variations in calorie burn don’t significantly impact weight within this timeframe. It’s a reminder that consistent habits matter more than daily changes when it comes to weight management.
This brings us to the end of the analysis. The findings revealed patterns in activity, calories, sleep, and weight that offer insights into user behaviors and wellness.
Summary
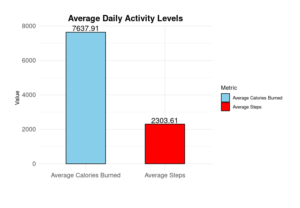
- Average Daily Activity Levels: Users burn an average of 7,367 calories and take 2,304 steps daily, indicating they engage in activities beyond step-based movements.
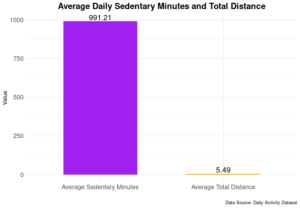
- Average Daily Sedentary Minutes and Total Distance: On average, users spend 991 minutes (over 16 hours) in sedentary activities and cover 5.49 miles.
- Daily Metrics by Day of the Week: Sundays show the highest steps and distance, indicating increased outdoor activities or workouts. Calories burned remain consistent throughout the week, suggesting metabolism plays a role. Sedentary minutes are consistent across the week.
- Correlation Between Total Steps and Calories Burned: A positive relationship exists, where more steps generally lead to higher calorie burn. However, outliers suggest other factors like metabolism or activity intensity also influence this.
- Relationship Between Sedentary Minutes and Calories Burned: A negative trend is observed, where more sedentary minutes lead to slightly lower calorie burn. Outliers indicate that some people burn significant calories despite being sedentary.
- Relationship Between Total Steps and Total Minutes Asleep: A weak negative relationship is seen, suggesting that as steps increase, sleep duration slightly decreases.
- Relationship Between Sedentary Minutes and Total Minutes Asleep: More sedentary minutes lead to less sleep, with a moderate negative correlation of -0.601.
- Relationship Between Total Steps and Sleep Efficiency: A slight negative trend exists, where increased steps slightly reduce sleep efficiency, though most remain above 90%.
- Relationship Between Sedentary Minutes and Sleep Efficiency: No significant trend is found, with most individuals maintaining around 90% sleep efficiency regardless of sedentary behavior.
- Calories Burned vs Weight (Colored by BMI): There is no strong correlation, although an outlier with a high BMI above 120 kg stands out for further review.
- BMI and Total Steps Over Time (April – May): BMI remains stable while Total Steps fluctuates, with no clear correlation between activity and BMI change.
- Calories Burned and Weight Over Time: No clear relationship is found, suggesting that factors like diet or metabolism are more influential in weight changes than calorie burn alone.
Conclusion
This analysis provides Bellabeat with a clearer understanding of how activity and health metrics are connected. While there are some trends, like the relationship between Total Steps and Calories Burned, other factors like metabolism and lifestyle play a big role. Considering all the insights from this analysis, Bellabeat can better personalize wellness strategies and explore other variables like diet and sleep for a more complete picture of health.
Recommendations
- Since the analysis shows a positive relationship between Total Steps and Calories Burned, Bellabeat could recommend daily step goals to users by implementing engaging campaigns like “10,000 Steps Challenges” within the Leaf app. This will not only encourage users to increase their activity levels but also effectively showcase the tracker’s role as a motivator in achieving fitness goals.
- With users spending an average of 991 minutes sedentary daily, the Leaf tracker can help promote healthier habits by sending reminders to move and stretch, encouraging users to take breaks throughout the day to reduce sedentary time.
- Given the weak negative correlation between Total Steps and Sleep Efficiency, Bellabeat should leverage the Leaf product to offer personalized sleep recommendations. The tracker could monitor sleep patterns and suggest activities or adjustments to improve sleep quality.
- Since various factors like metabolism and so on also affect Calories Burned and Weight, the Leaf tracker can provide more personalized recommendations. By tracking activity, sleep and stress, Bellabeat can offer users tailored advice to improve their overall wellness.
Limitations
- The data only covers a short period from 03.12.2016 to 05.12.2016, which may not fully capture long-term trends or variations in user behavior.
- The dataset includes data from only 30 Fitbit users, which may not be representative of a larger population, limiting the generalizability of the findings.
- The data is based on self-reported information from users, which could be subject to inaccuracies or biases in tracking activity, sleep, and weight.