Imagine you’re building a house. You need a sturdy foundation, reliable tools, and the ability to shape raw materials into something beautiful and functional. That’s where R comes in. For data scientists, R is more than just a programming language; it’s the workshop where we transform raw data into insights, build predictive models, and ultimately, create value. This “Beginners Guide to R Programming” is for anyone taking their first steps in this exciting field. We’ll explore the fundamentals of R, from installation and basic operations to powerful data manipulation techniques and stunning visualizations. Whether you’re a curious student, a seasoned professional looking to expand your skills, or simply someone fascinated by the power of data, this guide will provide a solid foundation for your R journey.
Key Takeaways
- R is a versatile tool for data analysis and visualization, perfect for beginners in data science.
- Setting up R and RStudio is straightforward, making it easy to start coding quickly.
- R offers powerful packages like dplyr for data manipulation and ggplot2 for creating stunning visuals.
- Understanding R’s data structures like vectors and data frames is crucial for effective data analysis.
- R’s active community provides a wealth of resources and support for new learners.
- Key Takeaways
- Advantages of R
- R vs Other Programming Languages
- Installing R and RStudio
- Basic R Syntax and Commands
- Vectors, Matrices, and Data Frames
- Lists and Factors
- Using dplyr and tidyr
- Creating Graphs with ggplot2
- What is R programming?
- Why should I learn R for data science?
- How do I start using R?
- What are the basic data structures in R?
- Can I use R for creating graphs and charts?
- Is R better than other programming languages for data science?
Introduction to R Programming
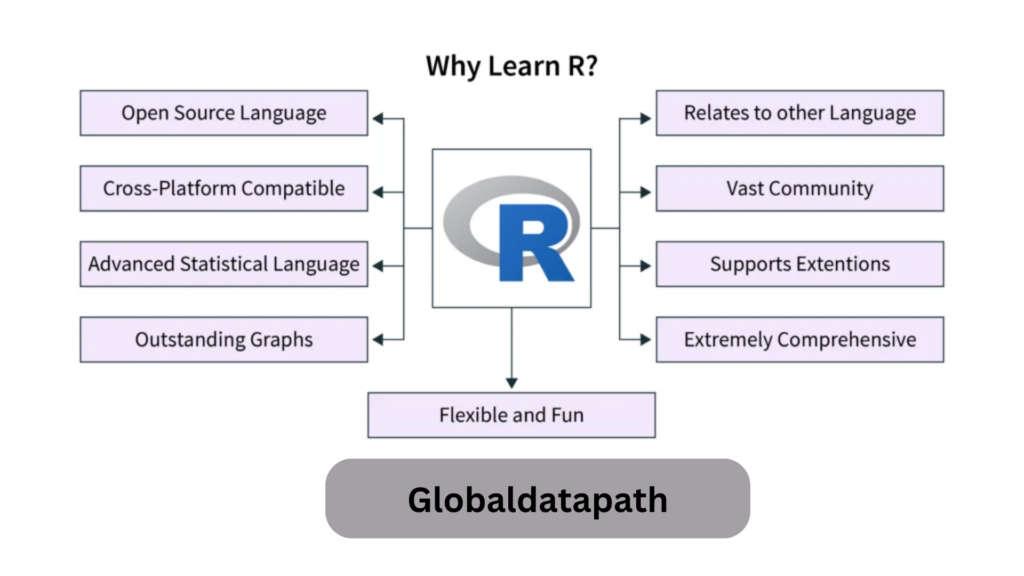
R is a programming language that’s been around for a while, but it’s really found its groove in the world of data science. Designed specifically for statistical computing and graphics, it’s no wonder R has become a go-to for analysts and researchers.
So, why is R such a big deal? Well, it’s open-source, which means it’s free to use and has a massive community backing it. This community is always coming up with new packages and tools, making R super versatile for all sorts of data tasks, from simple data cleaning to complex statistical modeling.
Here’s a quick rundown of what makes R stand out:
- Statistical Analysis: R was built with stats in mind. It offers a vast range of statistical tests and models.
- Data Visualization: With libraries like ggplot2, R can turn boring data into beautiful graphs.
- Community Support: There’s a huge, active community contributing to R’s growth, which means tons of resources and help are available online.
R isn’t just a tool; it’s a community. When you start learning R, you’re joining a global network of data enthusiasts. you can also read all the Benefits of R and why it stands out here!
If you’re stepping into data science or just looking to expand your programming skills, giving R a shot is a smart move. It’s powerful, flexible, and growing more popular by the day. Whether you’re a newbie or a seasoned pro, R has something to offer.
Why Choose R for Data Science

Advantages of R
R is a powerhouse when it comes to data science. First off, it’s open-source, meaning anyone can use it for free, and there’s a huge community of developers constantly improving it. Communities like R ladies, access free educational materials like R Bloggers, R Weekly, and interactive tutorials such as Tidy Tuesday You can also Utilize forums like Stack Overflow and RStudio Community for coding support. This community is a goldmine of resources and support. R is particularly strong in statistical analysis, making it the go-to for statisticians and data analysts. Its extensive library of packages lets you do everything from data cleaning to advanced machine learning. Plus, with visualization tools like ggplot2, you can create stunning graphs and plots that make your data come alive.
R vs Other Programming Languages
When you stack R against other programming languages, it shines in specific areas. Compared to Python, for example, R is tailored for statistical analysis and data visualization. Python, on the other hand, is more versatile, supporting a wider range of applications beyond data science. R comes with specialized packages like ggplot2 for visualization and dplyr for data manipulation, which are incredibly efficient for data-related tasks. Here’s a quick comparison:
| Feature | R | Python |
|---|---|---|
| Focus | Statistical analysis, data visualization | General-purpose, data analysis, web development |
| Libraries | ggplot2, dplyr | Pandas, NumPy, SciPy |
| IDEs | RStudio | Spyder, Jupyter |
R is a favored programming language among Data Scientists for its effectiveness in managing projects from inception to completion. It excels in data manipulation, statistical analysis, and visualization, making it an essential tool for those in the field of data science.
Setting Up R Environment
Installing R and RStudio
Getting started with R is straightforward. First, you need to download R from the Comprehensive R Archive Network (CRAN). Just head over to their website and grab the version that matches your operating system. Once you’ve got the installer, run it and follow the on-screen instructions. It’s pretty much like installing any other software.
After installing R, the next step is to set up an Integrated Development Environment (IDE) to make coding easier. RStudio is a popular choice among data scientists. It’s user-friendly and packed with features like syntax highlighting, a built-in console, and a data viewer. You can download RStudio from its official site. Pick the installer that suits your system, and you’re good to go.
Basic R Syntax and Commands
Now that you’ve got R and RStudio installed, it’s time to dive into the basics. R’s syntax might seem a bit quirky at first, but you’ll get the hang of it. Here are a few essentials to get you started:
- Variables: Create them using the
<-operator. For example,x <- 10assigns the value 10 tox. - Data Types: R supports various types like numeric, character, and logical. Knowing these will help you manage your data better.
- Functions: R has a rich set of built-in functions. You can call a function like this:
print("Hello, R!").
Remember, practice is key. The more you code, the more familiar you’ll become with R’s syntax and commands. Start small, and gradually tackle more complex tasks. Soon, you’ll be navigating R like a pro!
Data Structures in R
Vectors, Matrices, and Data Frames
R programming is all about handling data, and understanding its data structures is key to managing data efficiently. Vectors are the simplest form of data structure in R and are used extensively for data manipulation. You can think of vectors as a series of elements that are all of the same type, like numbers or strings. To create a vector, you can use the c() function:
# Creating a vector in R
vector <- c(1, 2, 3, 4, 5)
print(vector)
Matrices are like vectors but with a twist they have rows and columns, making them two-dimensional. This structure is useful when you want to perform operations on data in a grid format. You create matrices using the matrix() function:
# Creating a matrix in R
matrix_data <- matrix(1:9, nrow = 3, ncol = 3)
print(matrix_data)
Data Frames are probably the most flexible and widely-used data structure in R. They are similar to tables in Excel or SQL databases, where each column can contain different types of data. To create a data frame, you use the data.frame() function:
# Creating a data frame in R
data_frame <- data.frame(Name = c("Alice", "Bob"), Age = c(24, 28))
print(data_frame)
Understanding these structures is fundamental for any data science work in R. With vectors, matrices, and data frames, you’re well-equipped to tackle a variety of data tasks.
Lists and Factors
Lists in R are a bit like vectors but more versatile. They can hold elements of different types, including numbers, strings, and even other lists. This makes them incredibly useful when you need to organize complex data. You can create a list using the list() function:
# Creating a list in R
list_data <- list("Red", 20, TRUE, 1:5)
print(list_data)
Factors are used to handle categorical data in R. They are particularly useful in statistical modeling because they store data as levels. This can help with organizing and analyzing categorical data efficiently. You create factors using the factor() function:
# Creating a factor in R
factor_data <- factor(c("Male", "Female", "Male", "Female"))
print(factor_data)
These structures vectors, matrices, data frames, lists, and factors, form the backbone of data handling in R, making it a powerful tool for data analysis and statistical computing. For more on how vectors are used as building blocks in R, keep exploring!
Data Manipulation with R
Using dplyr and tidyr
When it comes to handling data in R, two packages you’ll likely hear about are dplyr and tidyr. These are your go-to tools for making data manipulation straightforward and efficient. R also have varieties of tools that are out there for you!
dplyr is all about making your data manipulation tasks easy to read and write. It offers a set of functions that help you filter, select, mutate, arrange, and summarize data. Here’s a quick look at some of these functions:
- filter(): Choose rows that meet certain criteria.
- select(): Pick specific columns.
- mutate(): Add or change columns.
- arrange(): Sort your data by columns.
- summarize(): Create summary statistics like mean or sum.
Imagine you have a dataset of employees with columns for name, age, and salary. You might filter for employees over 25, select only their names and salaries, or arrange them by salary. These tasks become simple with dplyr.
Here’s a quick example:
library(dplyr)

data <- data.frame(
  Name = c("Alice", "Bob", "Charlie", "David", "Eve"),
  Age = c(24, 28, 35, 40, 22),
  Salary = c(50000, 60000, 70000, 80000, 45000)
)

filtered_data <- filter(data, Age > 25)
selected_data <- select(data, Name, Salary)
With tidyr, you can reshape your data. It helps in making datasets “tidy,” which means each variable is in its own column, and each observation is in its own row. Functions like gather(), spread(), separate(), and unite() are commonly used to reshape data.
“Tidy data is all about structure: making sure your dataset is easy to work with, with clear variable and observation separation.”
Both dplyr and tidyr are essential for anyone looking to get serious about data manipulation in R. They help you get your data in the right shape for analysis, making your workflow smooth and your code more readable.
Data Visualization in R

Creating Graphs with ggplot2
Data visualization is all about turning numbers into pictures, helping you see patterns, trends, and outliers in data. In R, one of the go-to tools for this is ggplot2. It’s like the Swiss Army knife for data visualization, letting you make everything from simple scatter plots to fancy multi-layered graphs.
Why ggplot2? Well, it’s built on the “Grammar of Graphics,” which means you can layer different elements on top of each other to build up a plot. Want to add a trend line to your scatter plot? Easy! Just add geom_smooth() to your code.
Here’s a quick rundown on making a basic scatter plot:
library(ggplot2)

ggplot(data = my_data, aes(x = x_variable, y = y_variable)) +
  geom_point()
This code snippet will give you a simple scatter plot of x_variable against y_variable. But you can do so much more. Let’s talk about customization:
- Colors and Shapes: Use
aes(color = factor_variable)to color points by a factor, oraes(shape = factor_variable)to change their shapes. - Sizes: Adjust point sizes with
aes(size = numeric_variable). This can help emphasize certain data points. - Themes: ggplot2 comes with several themes like
theme_minimal()ortheme_classic()to change the overall look.
Adding More Layers
With ggplot2, adding layers is as easy as pie. You can add lines, text, and even other shapes:
- Lines: Use
geom_line()to connect points with lines. - Text: Add labels with
geom_text()to annotate your plot.
“Visualizing data is like telling a story with numbers. Each layer you add to your plot is a new chapter of that story.”
In summary, R’s ggplot2 package is a powerhouse for creating stunning, informative visualizations. Whether you’re new to data visualization or a seasoned pro, ggplot2 offers the flexibility and depth to make your data come alive.
Conclusion and Next Steps
Reflecting on your journey with R programming, it’s clear that this language offers a robust set of tools for anyone diving into data science. With its open-source nature and extensive package ecosystem, R is an ideal choice for statistical analysis, data manipulation, and more. As you continue to explore R, consider these next steps to deepen your understanding and expand your skills:
- Set Clear Goals: Define what you want to achieve with R, whether it’s mastering data visualization or building complex machine learning models.
- Engage with Communities: Join forums and online communities, like Stack Overflow or R-specific groups, to seek advice and share experiences.
- Work on Projects: Start with small projects and gradually tackle more complex ones. This hands-on practice is essential for solidifying your skills.
Remember, learning R is a marathon, not a sprint. Celebrate your progress and don’t hesitate to ask for help when needed.
By consistently challenging yourself with advanced projects, you’ll not only improve your programming skills but also build a strong portfolio. This hands-on experience with complex data tasks can set you apart in the competitive field of data science and prepare you for the challenges of professional work.
As you move forward, consider exploring R’s capabilities in areas like machine learning and data visualization. These skills are not only essential for data science but also open up new opportunities in various fields. Keep experimenting, keep learning, and most importantly, enjoy the journey!
Conclusion
So, there you have it! R is a pretty cool tool for anyone stepping into the world of data science. It’s got all these neat features for analyzing and visualizing data, which is why it’s a favorite among data folks. Sure, it might seem a bit tricky at first, but once you get the hang of it, you’ll see why it’s so popular. Whether you’re looking to crunch numbers or make some snazzy graphs, R’s got your back. Just remember, like anything new, it takes a bit of practice. So, keep at it, and soon enough, you’ll be using R like a pro. Happy coding!
Frequently Asked Questions
What is R programming?
R programming is a language used for data analysis, making graphs, and statistical tasks. It’s free and open-source, which means anyone can use it and make changes.
Why should I learn R for data science?
R is great for data science because it has lots of tools for handling and showing data. It’s especially good for statistics, making it a favorite for data scientists.
How do I start using R?
To start with R, you need to download it from the internet and install it on your computer. You can also use RStudio, which makes writing and running R code easier.
What are the basic data structures in R?
In R, you can use vectors, matrices, and data frames to hold and work with data. You can also use lists and factors for more complex data.
Can I use R for creating graphs and charts?
Yes, R is excellent for making graphs and charts. You can use the ggplot2 package to make pretty and informative visualizations.
Is R better than other programming languages for data science?
R is very good for statistics and data visualization. While other languages like Python are also popular, R is often preferred for tasks involving lots of data analysis and statistics.