Health is one thing we all care about, whether we think about it every day or not. Obesity, in particular, has become a growing concern worldwide, affecting not just appearance but overall well-being. It’s linked to various health risks, from heart disease to diabetes, making it a serious issue that demands attention. Yet, understanding obesity isn’t just about knowing the risks, but also recognizing the role of eating habits, physical activity, and lifestyle choices in shaping health outcomes.
Coming from an agricultural extension and communication background, I’ve always been passionate about sharing information that improves people’s lives. In agriculture, it’s about helping farmers and rural environment make better decisions for higher yields and sustainability. But when you step back and look at it, isn’t that what we all need? Information that helps us live better?
The other day, my mom casually told me, “You need to start watching your weight; you’re getting fat!” I laughed it off, but it got me thinking, how much do I actually know about weight gain and health beyond the usual advice we hear? That moment sparked my curiosity, and I decided to dive into data-driven insights on obesity.
So by analyzing eating habits, physical activity, family history, and their relationship to obesity levels, this project uncovers key patterns that healthcare professionals, policymakers, and businesses can use to make informed decisions. With the right insights, they can design better prevention programs and improve health outcomes. Because just like in agriculture, the right information at the right time can change lives.
About Dataset
The dataset, titled “Estimation of Obesity Levels Based On Eating Habits and Physical Condition”, comes from the UCI Machine Learning Repository. It contains 2,111 rows and 17 columns, providing information about individuals from Mexico, Peru, and Colombia. The dataset focuses on factors related to obesity, including eating habits, physical activity, and lifestyle choices.
Column Descriptions:
- Gender – Male or Female.
- Age – The person’s age in years.
- Height – Height in meters.
- Weight – Weight in kilograms.
- family_history_with_overweight – Whether the person has a family history of being overweight (yes/no).
- FAVC – If the person frequently consumes high-calorie foods (yes/no).
- FCVC – Frequency of vegetable consumption (scale from 1 to 3).
- NCP – Number of main meals per day.
- CAEC – Frequency of consuming food between meals (Never, Sometimes, Frequently, Always).
- SMOKE – Whether the person smokes (yes/no).
- CH2O – Daily water intake (scale from 1 to 3).
- SCC – If the person monitors their calorie intake (yes/no).
- FAF – Physical activity frequency (scale from 0 to 3).
- TUE – Time spent using technology (scale from 0 to 3).
- CALC – Frequency of alcohol consumption (Never, Sometimes, Frequently, Always).
- MTRANS – Main mode of transportation (Automobile, Bike, Motorbike, Public Transportation, Walking).
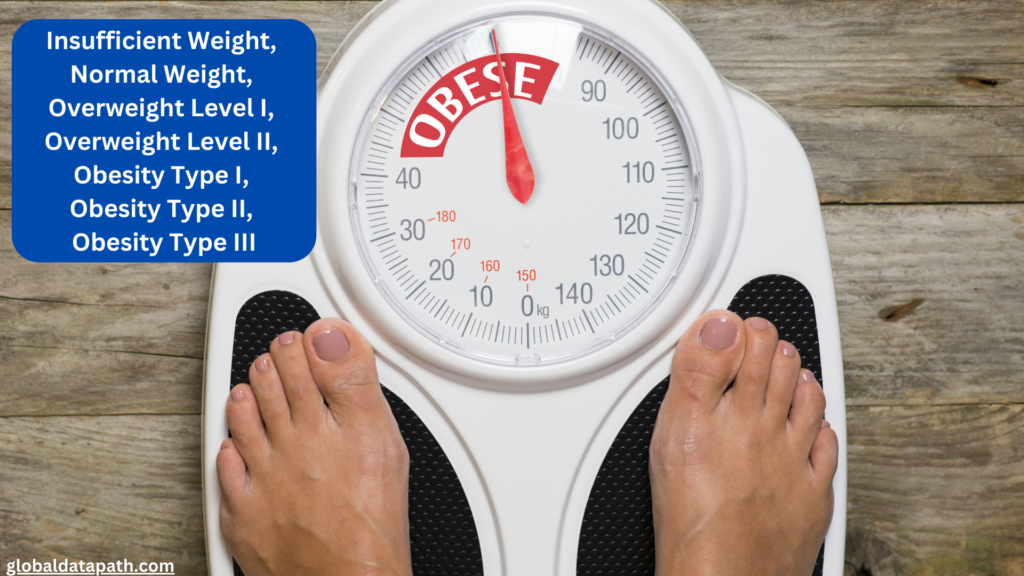
- NObeyesdad – Obesity level (Insufficient Weight, Normal Weight, Overweight Level I, Overweight Level II, Obesity Type I, Obesity Type II, Obesity Type III).
This dataset provides a structured view of how different lifestyle factors relate to obesity levels, making it useful for healthcare analysis and decision-making.
Data Cleaning and Manipulation
This analysis was conducted using Python, using libraries like Pandas, Numpy, Statsmodels, and Scikit-learn for data processing, statistical analysis, and machine learning.
- Removed Duplicate Entries: Eliminated any duplicate rows to ensure the dataset contained only unique records.
- Generated Summary Statistics: Calculated key statistics such as mean, standard deviation, and count for numerical features to understand data distribution.
- Analyzed Age Trends by Obesity Level:
- Grouped data by obesity level and calculated the average age for each category.
- Sorted obesity categories based on average age for better trend visualization.
- Converted Obesity Levels into Numeric Form: Transformed categorical obesity labels into numeric values to facilitate analysis.
- Encoded Categorical Lifestyle Factors: Applied label encoding to convert text-based lifestyle factors (e.g., frequent consumption of high-calorie food) into numeric values.
- Built a Regression Model for Age Trends:
- Used Ordinary Least Squares (OLS) regression to analyze how obesity levels correlate with age.
- Created a regression line to observe trends in the data.
- Trained a Random Forest Model:
- Applied a Random Forest classifier to determine the most influential factors related to obesity.
- Extracted feature importance scores to identify key contributors to obesity levels.
- Examined Family History and Obesity Connection:
- Grouped data by family obesity history and obesity level.
- Calculated proportions within each family history category to see how likely individuals were to develop obesity based on their family background.
📌 View the complete analysis code on GitHub
Objective of the Case Study
The goal of this analysis is to explore how lifestyle choices influence obesity levels. Using data on eating habits, physical activity, and personal health factors, I aim to uncover patterns that can help improve obesity prevention efforts.
To guide this analysis, I focused on key questions:
- How do eating habits (e.g., snacking, meal frequency, vegetable intake) correlate with obesity levels?
- Does physical activity frequency significantly impact obesity, and how does it vary by gender?
- Is there a strong relationship between family history of obesity and a person’s weight status?
- How does technology use (TUE) affect obesity risk, does more screen time lead to higher obesity levels?
- What is the impact of different transportation modes on obesity? Are people who walk more less likely to be overweight?
- How do water intake and alcohol consumption influence obesity levels?
By answering these questions, I aim to provide insights that healthcare professionals can use to design targeted obesity prevention programs and help people make informed lifestyle choices.
Key Findings
To start my analysis, I examined the relationship between Obesity levels and Average age.
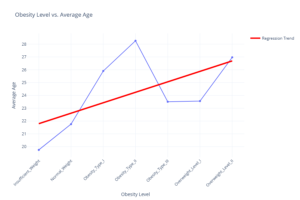
This chart explores the relationship between average age and different obesity levels. There’s a slight tendency for average age to increase as obesity levels rise, especially when we look at the trend line. But, there are some interesting variations. For example, the “Obesity Type II” category has a noticeably higher average age than the others. While there’s a general upward trend, the connection isn’t perfectly straight, suggesting that age might be one contributing factor among many when it comes to obesity, and other influences are also likely at play. It’s not simply a case of getting older and automatically having a higher obesity level.
Next, I looked into the relationship between lifestyle factors and obesity levels using a correlation heatmap and a feature importance analysis. The first visual examines the correlation between different lifestyle habits and obesity, while the second visual highlights which factors have the greatest impact.
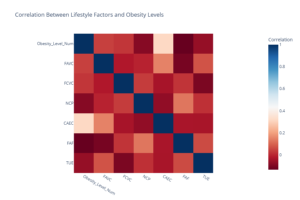
This first visual shows the connections between lifestyle and obesity. We see some interesting things. For example, how often someone eats high-calorie foods (“FAVC”) seems to have a pretty strong link to obesity levels. Eating veggies (“FCVC”) also shows a connection, though maybe not as strong. Things like how much water someone drinks (“CAEC”) or how much time they spend on screens (“TUE”) seem to have a weaker relationship. It’s like a gentle hint that what we eat might play a bigger role than other habits, but it’s all part of the bigger picture.
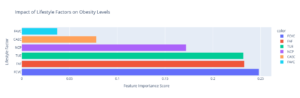
To better understand which lifestyle factors have the biggest impact on obesity levels, this second visual shows us how important each factor is. We can see that eating vegetables (FCVC) stands out as the most influential factor. Following close behind are physical activity (FAF) and screen time (TUE), suggesting that these also play significant roles. Eating high-calorie foods (FAVC) and the time between meals (NCP) appear to have a moderate impact, while water consumption (CAEC) seems to have the least influence. This gives us a clearer idea of which lifestyle choices might be most helpful to focus on for maintaining a healthy weight.
Both correlation and feature importance analyses highlight the significant role of lifestyle factors, especially diet and physical activity, in influencing obesity levels, though their precise contributions warrant further study.
Next, I looked into how physical activity levels might differ across various obesity categories.
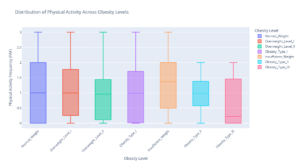
This chart looks at how often people are physically active across different obesity levels. It hints that folks with a healthy weight tend to have a wider range of activity, some are super active, while others less so. As obesity levels rise, the typical amount of physical activity seems to dip a bit, and people’s activity levels become more similar. Still, there’s lots of overlap, showing that even some people with obesity are quite active. So, while exercise is probably important, it’s just one piece of the puzzle when it comes to weight.
Next, I wanted to see if there were any differences in physical activity between genders within each obesity level.
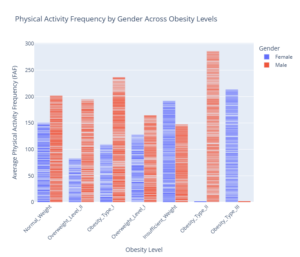
This chart breaks down average physical activity by gender for each obesity category. It’s interesting to see that for most obesity levels, men tend to report slightly higher average physical activity than women, though the differences aren’t huge. However, the patterns are pretty similar for both genders, physical activity tends to decrease as obesity levels increase. This support the idea that while gender might play a small role, the overall trend of reduced physical activity with higher obesity levels holds true for both men and women.
The next thing I wanted to explore was the role of family history in obesity, as this can be a significant risk factor. This is so important because it helps us understand if there might be a genetic predisposition at play.
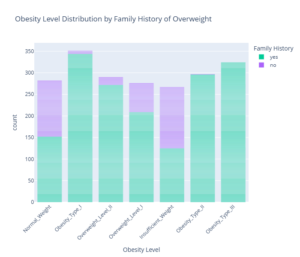
This chart shows how family history of overweight is distributed across different obesity levels. It’s immediately clear that a family history of overweight is very common among all obesity categories. In fact, for most levels, a large majority of individuals report having a family history of overweight. While the proportion might vary slightly between categories, the overwhelming trend is that a positive family history is highly prevalent across the entire spectrum of obesity. This strongly suggests that genetic or shared environmental factors within families could indeed contribute to an individual’s likelihood of experiencing overweight or obesity.
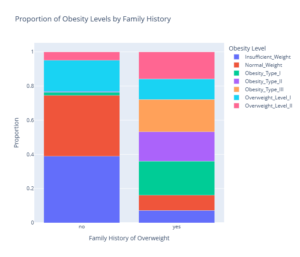
To better understand the distribution of obesity levels within each family history group, I created this visualization showing the proportion of each obesity level for those with and without a family history of overweight.
This chart really drives home the point about family history. Even though the previous chart showed lots of people with a family history across all obesity levels, this one shows us the proportions. It reveals that for people without a family history of overweight, the most common category is actually normal weight. However, for those with a family history, the proportions shift dramatically. We see a much larger share of individuals falling into the overweight and various obesity categories. This strongly support the idea that a family history of overweight significantly increases the likelihood of an individual experiencing overweight or obesity themselves. It’s like family history loads the dice a bit.
Next, let’s see how technology use relates to obesity levels.
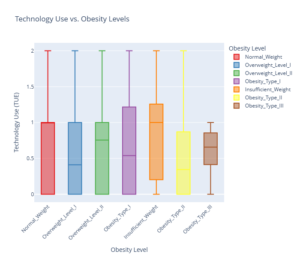
This chart explores the link between screen time (TUE) and obesity. While average screen time doesn’t change much across obesity levels, the variability does. People with normal weight have similar screen time habits, but those with higher obesity show more diverse patterns, some use tech a lot, others very little. This hints that screen time might not directly cause obesity, but it could play a role for some, perhaps by impacting activity levels.
Let’s see if daily water intake has any connection to obesity levels.
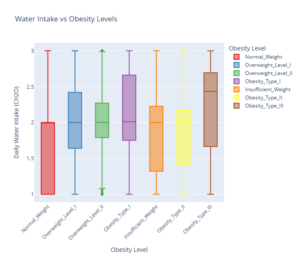
This chart visualizes the distribution of water consumption across the different obesity categories. It’s interesting to note that while there’s some variation, there isn’t a clear trend of water intake increasing or decreasing consistently with obesity levels. Some categories show slightly higher median water intake than others, but the ranges overlap quite a bit. This suggests that daily water intake, at least as measured in this dataset, might not be a primary differentiating factor when it comes to obesity. While staying hydrated is important for overall health, it doesn’t appear to be the key driver in determining obesity levels in this particular population.
Lastly, let’s examine the common belief that alcohol consumption contributes to obesity.
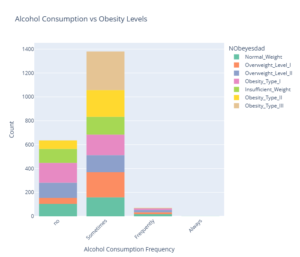
This chart explores the relationship between drinking frequency and obesity levels. Looking at the data, we see a clear trend: the “Sometimes” category for alcohol consumption has the highest number of individuals across all obesity levels. While the “no” category is also significant, especially for normal weight individuals, the “Sometimes” group dominates. Interestingly, the “Frequently” and “Always” categories are quite small for all obesity levels. This suggests that occasional alcohol consumption is the most common pattern, regardless of weight status. There isn’t a strong indication that frequent or excessive alcohol use is directly linked to higher levels of obesity in this dataset. It seems the occasional drink is the norm for many, regardless of whether they are classified as normal weight, overweight, or obese.
Summary
In this exploration of factors related to obesity, we’ve seen some interesting patterns. Dietary habits, particularly vegetable consumption and the frequency of high-calorie food intake, appear to be strongly related to obesity levels. Physical activity, while showing some connection, paints a more complex picture, with variability in activity levels increasing at higher obesity categories. Family history of overweight emerges as a significant factor, with a strong presence across all obesity levels, and a clear shift towards higher proportions of overweight and obese individuals among those with a family history. While screen time shows some variability in higher obesity levels, and age shows a slight upward trend, the links aren’t as straightforward. Finally, neither water intake nor alcohol consumption, at least in the way they were measured here, show a clear, direct relationship with obesity levels.
Conclusion
Our findings point towards a complex interplay of factors contributing to obesity. Dietary choices and family history appear to be particularly influential, suggesting that both lifestyle and genetic predispositions play important roles. Physical activity also seems to be a key element, though its relationship with obesity may be more nuanced than simply “less activity equals more obesity.” While other factors like screen time and age might contribute, their impact is less clear-cut. Importantly, our analysis highlights the need to consider multiple factors together, rather than focusing on single causes. It also underscores the importance of further research to fully understand the complex web of influences that contribute to obesity. This deeper understanding will be crucial for developing effective and personalized interventions to support individuals in achieving and maintaining healthier weights.
Recommendations
- I suggest healthcare providers prioritize dietary counseling, focusing on vegetable intake and mindful eating, given the strong diet-obesity link.
- I recommend routine family history screening by healthcare professionals to identify at-risk individuals early on.
- I advise healthcare providers to conduct holistic lifestyle assessments, including screen time, for tailored recommendations.
- I believe public health campaigns should emphasize healthy eating, especially increased vegetable consumption, based on my findings.
- I propose policymakers invest in community programs improving access to affordable, healthy foods.
- I encourage businesses to implement wellness programs promoting healthy diets and active lifestyles among employees.
Limitations
- Correlation, not causation: This analysis shows relationships, not what causes what.
- Self-reported data: Habits were likely self-reported, which can be inaccurate.